


Ampron Sky: air traffic, airport performance and GNSS interference in one open view
Article for the Estonian Aviation Cluster newsletter. Ampron OÜ, 17.10.2026
Ampron makes industrial LED and LCD displays in Peetri, next to Tallinn Airport. Our screens in airports, ports and cities show live data that comes from someone else’s system. To understand that kind of data better ourselves, we built Ampron Sky. It is a web app that shows air traffic from public data the way a controller sees it. It is free, needs no account and runs in any browser, including phones and tablets.
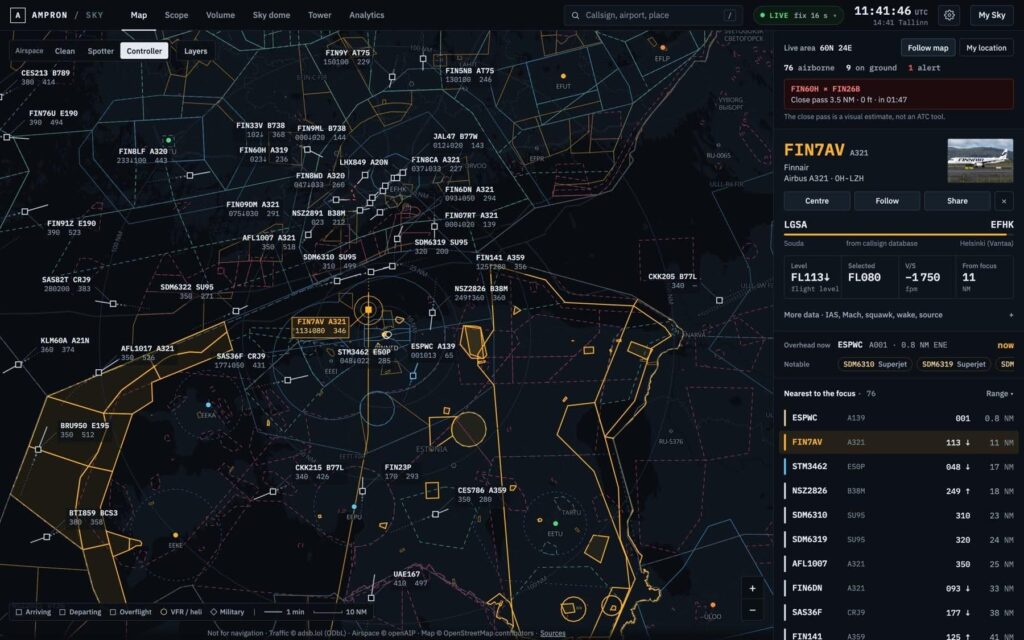
The map over Tallinn: controller data blocks, airspace and a selected flight’s card
What it does
A worldwide map. Aircraft are drawn as controller data blocks: callsign, type, flight level, selected level and speed. The map also carries 34 000 openAIP airspaces worldwide, FIRs, navaids, runways, METAR, TAF and SIGMETs. You choose how much airspace detail to show with three presets (Clean, Spotter, Controller). For Estonia, the map shows the areas activated by EANS NOTAMs and the airspace use plan (AUP) while they are active. It also shows Estonia’s drone geozones (EANS UTM, about 250 zones), refreshed every two minutes.
Four views of the same sky. Scope is a classic radar display. Volume shows the traffic in 3D. Sky dome shows the sky from where you stand, with satellites and the next pass of the ISS. Point your phone at the sky and it tells you which aircraft is up there.
Tower: an aerodrome controller’s working position. You can open a dedicated view for any airport. It has a surface map built from OpenStreetMap with taxiways, holding points and stands, an approach radar, and a wind rose with head- and crosswind components. It shows which runway is in use and whether it is occupied. Electronic flight strips are split into TWR/GND/DEL and grouped as inbound, final, runway, holding and just departed. Every one of those states is derived from ADS-B.
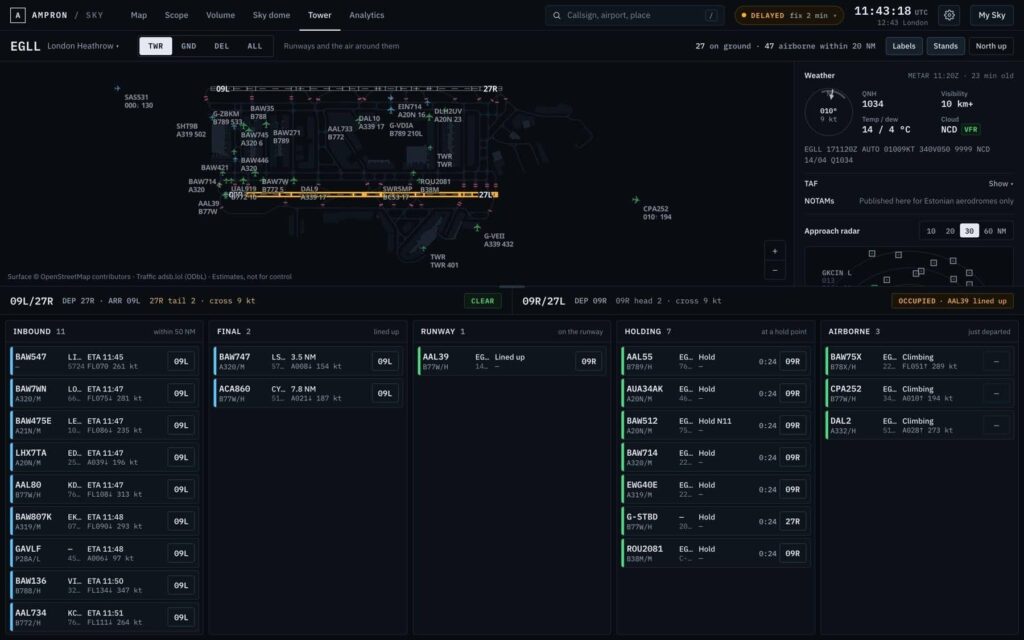
Tower view at London Heathrow: surface, runways and flight strips
What the traffic is doing. Flights are tagged when they are holding (HOLDING), going around (GO-AROUND) or possibly diverting (DIVERTING). Emergency squawks and close passes raise an alert; the close-pass alert is a visual estimate, not an ATC tool. A measuring tool shows the vertical separation between two aircraft and their closest point of approach. The app also works out whether an aircraft is leaving a contrail.
For screens. Board is a lobby or airport display: what is overhead now and what comes next. It runs in kiosk mode on an LED panel or embeds as a widget on another site. That is our own core business.
Analytics for the Baltic
Since 16 October we have been recording the Gulf of Finland and the southern Baltic around the clock, and we keep the archive for two years. On that archive we offer:
- Replay: play back any recorded moment in every view, at up to 60 times real speed.
- Airport performance: indicators modelled on Eurocontrol’s: movements per hour, additional approach time (ASMA), taxi times, runway occupancy, arrival spacing, go-arounds and holding.
- Airspace: Tallinn FIR traffic flows and the use of Estonia’s restricted areas from NOTAMs and the AUP, including civil flights inside active areas.
- Efficiency and environment: continuous descent and climb operations (CDO/CCO), fuel and CO₂ (OpenAP model), and noise screening (N65 by day, N60 at night) around airports.
- GNSS interference: our newest addition.
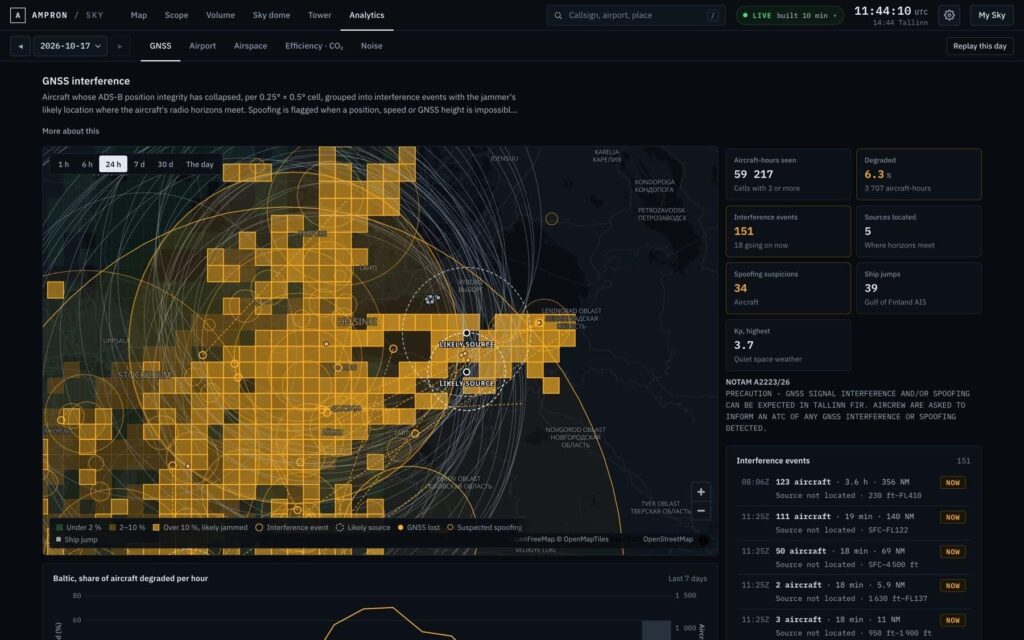
GNSS interference over the Baltic: jammed areas, events and the likely jammer location
GNSS interference as an open situational picture
Satellite navigation over the Baltic has been jammed almost daily since 2023, and EANS has a standing NOTAM about it. Ampron Sky now shows the interference as events: where it happened, for how long, over how large an area and how many aircraft it affected. Where the data allows, it also draws the jammer’s likely location on the map.
When an aircraft loses or regains GPS, it is crossing the jammer’s radio horizon. Where the horizon circles of several aircraft intersect is where the jammer most likely stands. On the first nights, the Gulf of Finland events repeatedly pointed to the southern coast of the gulf, west of St Petersburg. A second source area emerged on the Kaliningrad coast.
The app also runs four spoofing checks. On the morning of 17 October, 19 aircraft reported the same spot east of St Petersburg for about two and a half hours; they were not actually there. Ships are watched the same way through Fintraffic’s open AIS feed. On the map, aircraft carry the tags GNSS LOST, SPOOFED and GNSS RFI AHEAD. The last one means an aircraft is flying into an area where others are losing GPS right now.
All of this is an estimate from public data. The app is not for operational use or navigation, and it says so in every view.
Try it and tell us
sky.ampron.eu is open to everyone. We would welcome feedback from cluster members: what is useful, what is missing and what analysis Estonian aviation needs. Write to us at gen@ampron.eu.
Gen Vagula, CEO, Ampron OÜ